Table of Contents
To check the correct execution of an automation, you have the possibility to view the execution log. In this log, SeaTable records the following information for each automation run: execution time, execution condition, status and warnings, if any. There are also comprehensive statistics for all automation runs.
To take a look at the execution log
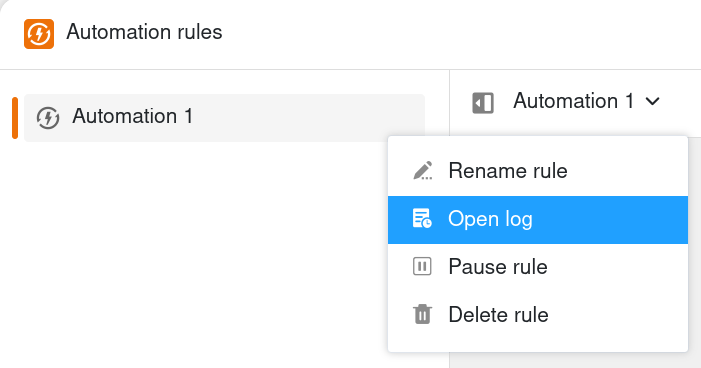
- Click in the base header, and then click Automation Rules.
- Move the mouse cursor over the automation rule whose log you want to view.
- Click on the three dots and then on Open log.
Structure of the execution log
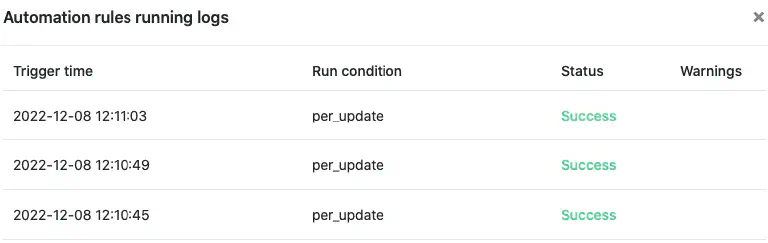
You can view the following information in the execution log of an automation:
Execution time
Here SeaTable stores the exact time when the trigger initiated the automation.
Execution condition
If the automation is triggered by the change or addition of a record, the message per_update appears. On the other hand, if the automation is triggered periodically, the message per_day/week/month appears.
Status
The status indicates whether the automation was executed successfully. If this is the case, the message Success appears here.
Warnings
If there were problems during the execution of an automation, a corresponding warning message appears here.
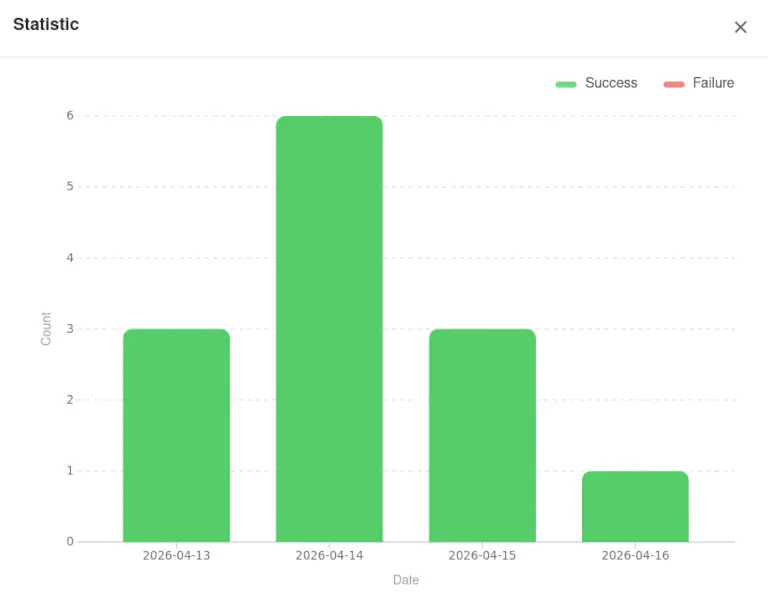
Statistics of all automation runs
You can also view the statistics on how many automation runs have taken place in total within the base, regardless of individual automation rules. This allows you to find out how often your automation rules are triggered and how many of the automation runs available to you in your monthly subscription you have already used.
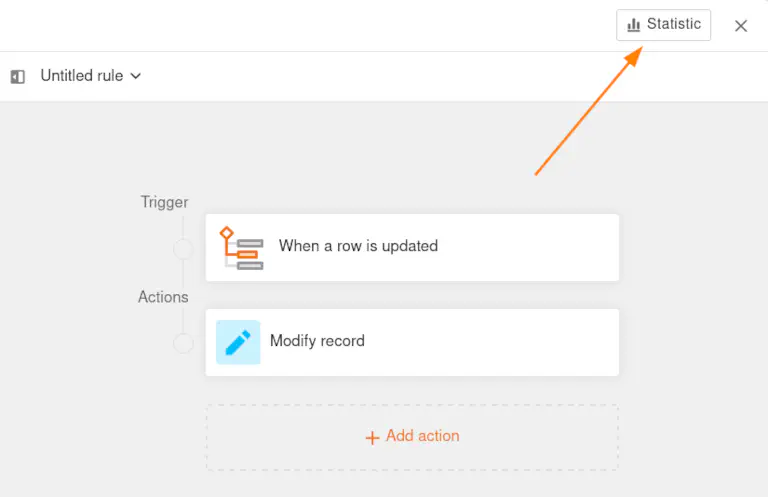
- Click on Statistic in the top right-hand corner of the open automation editor.
- This opens a window in which you can see the number of all automations executed per day.