Table of Contents
SeaTable plugins give you the opportunity to see your data from completely different perspectives and use extended functions. For example, visualize locations, org charts and table relationships, create laid-out documents or set up an AI chat in your base. In the following article, we explain which plugins are available in SeaTable and how you can use them.
What is a plugin?
In SeaTable you can create different views for your tables, with which you can visualize your data, for example, in calendars, galleries and tree diagrams. Beyond that, there are plugins.
A plugin is an optional software component in SeaTable that offers you additional functions. Various plugins can be activated in each base, which display the data of the respective table, for example on maps, in org charts or documents. You can also use extended functions to track duplicates, set up an AI chat, or let your creativity run free on the whiteboard.
Read more about how to activate a plugin in the linked help article.
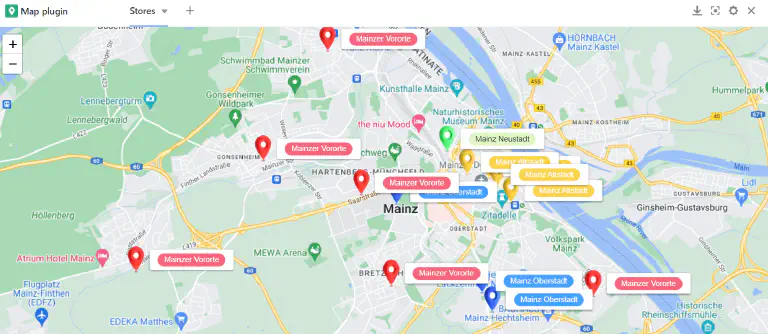
Map plugin
Locations can be displayed on a map with the map plugin. You can visualize the entered geographic information with position markers or images. The map plugin can handle GPS coordinates as well as addresses. However, addresses must be unique in order to be displayed.
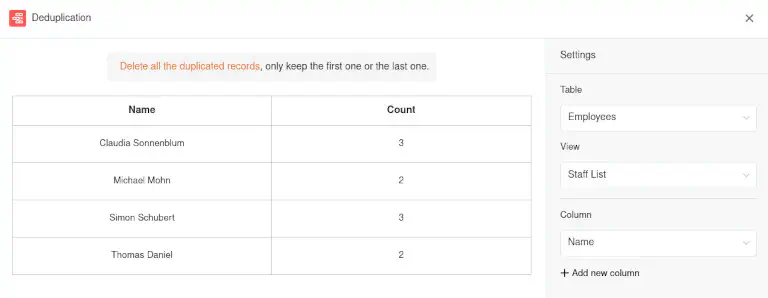
Data deduplication plugin
The data deduplication plugin uncovers duplicate entries in a table. This is especially helpful with large amounts of data to detect duplicates and remove them. You can delete all duplicate entries with just one click.
More about the data duplication plugin
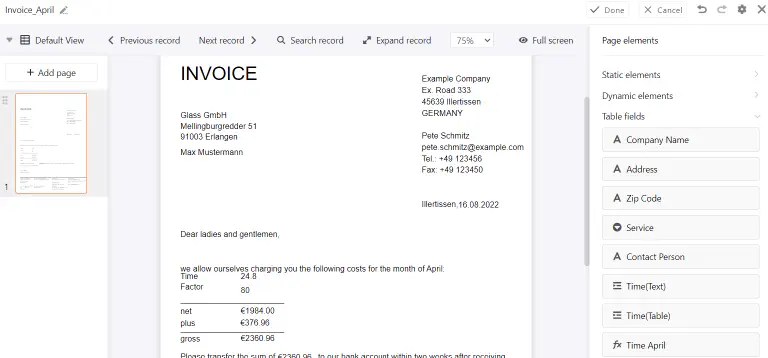
Page design plugin
Using the Page Design plugin, you can layout documents such as form letters, business cards, and certificates and populate them with the data in your table. More precisely, you can build layouts with static elements that are completed and customized with dynamic elements and table fields. These offer you the great advantage of inserting all related information (for example, a person’s name, address, and job title) into standardized templates, depending on the record, without the need to manually copy data into the documents. In this way, you can create print-ready invoices, certificates or other important documents from the stored data with just a few clicks.
More about the page design plugin
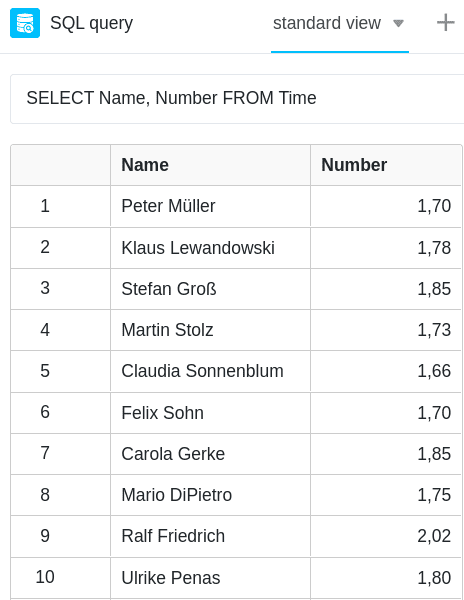
SQL query plugin
The SQL query plugin is perfect for direct execution of SQL commands and is therefore especially interesting for database professionals who work with larger amounts of data.
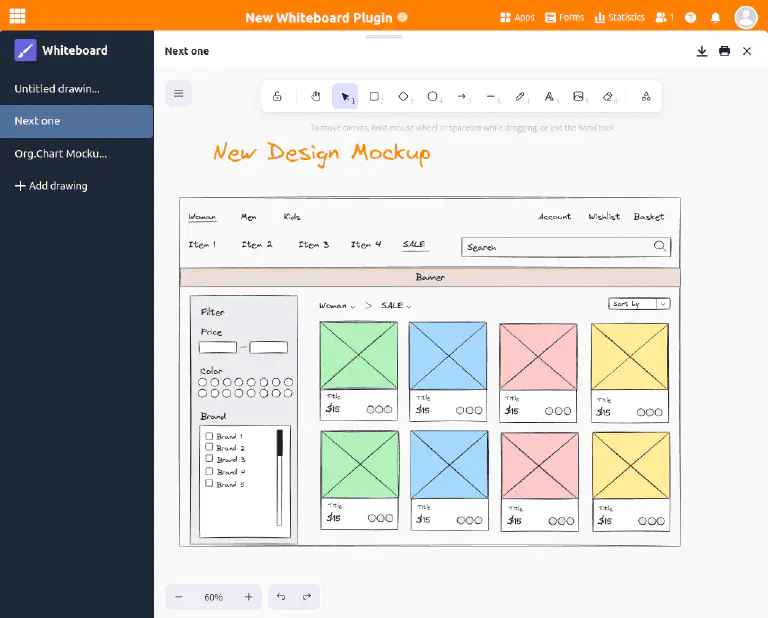
Whiteboard plugin
The whiteboard plugin gives you the freedom to graphically visualize processes and structures that you cannot display with the previous plugins. You can also freely sketch layouts and mockups. For the design, you have various elements such as squares, ellipses and arrows as well as tools such as pen, eraser and the text tool to choose from.
More about the whiteboard plugin
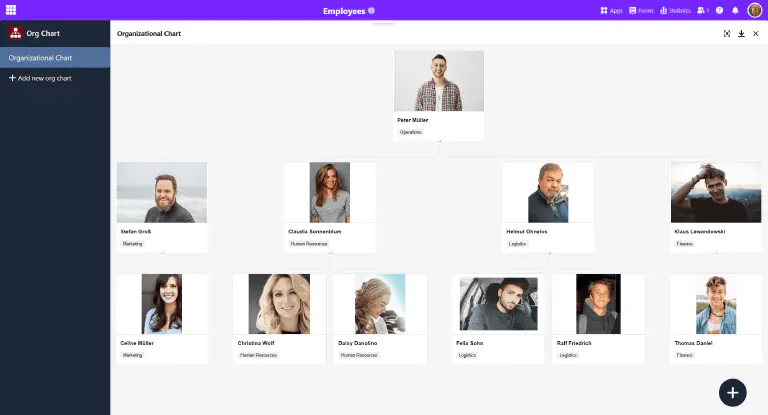
Organizational chart plugin
You can use the organization chart plugin to display hierarchies between the data records in a table. This is useful, for example, to visualize the positions in a company or superordinate and subordinate tasks in a project.
More about the organization chart plugin
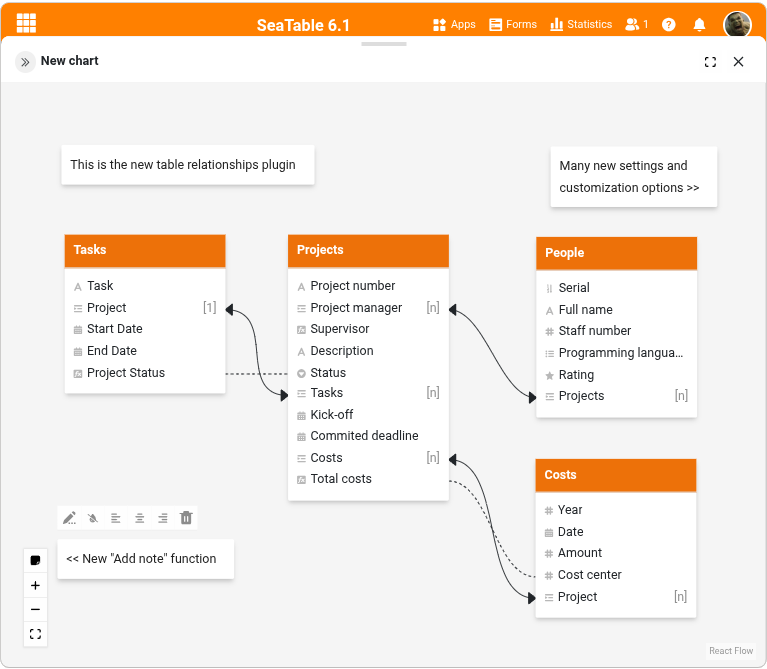
Table relations plugin
Especially when there are many tables with dozens of columns in a base, it is easy to lose track of how they relate to each other. Using the table relationships plugin, you can visualize which tables are linked to each other via which columns.
More about the table relationships plugin
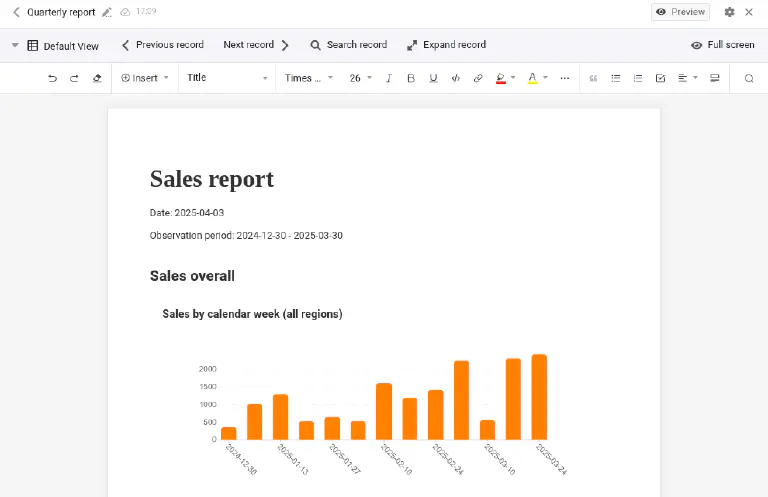
Report design plugin
With this plugin you can create multi-page reports in which tables, charts and fields are dynamically fed with data from your base. It is similar to the page design plugin in that it also creates PDF documents based on laid-out templates. However, the static and dynamic elements are not positioned pixel-precisely on the template, but placed one below the other in sequence, like in a word processor (e.g. Microsoft Word or Google Docs).
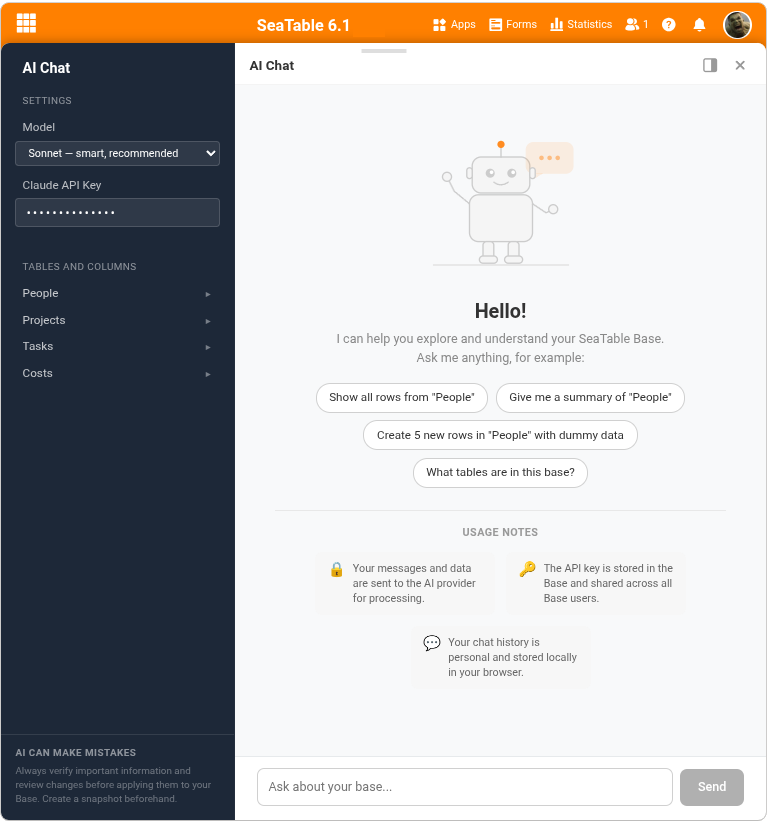
AI chat plugin
The latest plugin from SeaTable is absolutely in tune with the times. It allows you to set up an AI chat with your preferred language model. This way you can edit and analyze your bases in natural language, e.g. create records, change values, link rows or create analyses.
Other helpful articles
Statistics
The statistics module allows you to display data in all kinds of graphics and statistics. The following chart types are available to you: column, bar, line and pie charts, as well as maps, thermal images, speedometers and pivot tables. You can configure the right visualization for you in the various graphics and build a dashboard with the most important statistics.
More about the statistics module
Forms
With the form editor, you can create a web form from the columns of a table with which you can have users enter certain data in the fields of an online survey.