Table of Contents
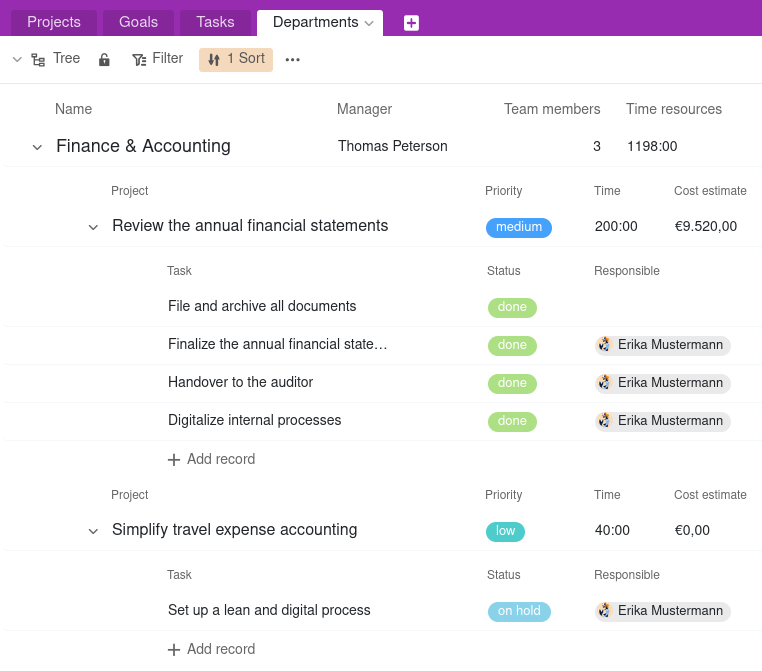
The tree view enables the compact hierarchical display of linked data records. This means that you can visualize data that is located in different linked tables at different levels in a tree diagram. The view provides a structured overview, especially for large amounts of data such as financial or project data.
How the tree view works
Before you create a tree view, you should consider which tree structure (i.e. hierarchy of linked data records in your base) makes sense: In a project portfolio , for example, this could be the departments on the first level, the projects on the second level and the tasks on the third level. Accordingly, the departments, projects and tasks must be recorded in three different tables that are linked to each other. Each task is assigned to a project, which in turn is subordinate to a department.
You define how the data records depend on each other and which tables are at which level using the Levels. You can currently display up to three levels, i.e. data from three tables, in the tree view.
How to create a tree view
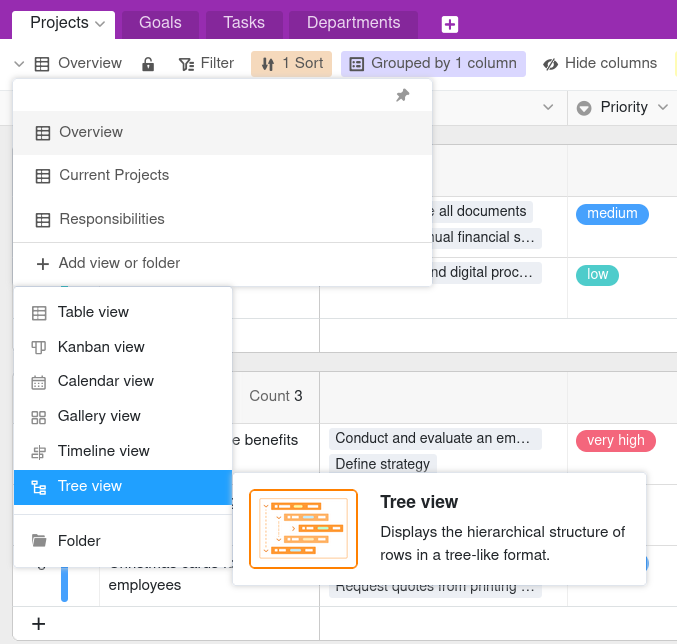
- Click on the name of the current view.
- Click on Add view or folder and select the desired view type.
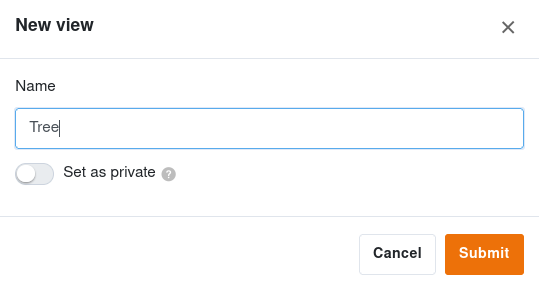
- Give the new view a name.
- Activate the slider if the new view should not be visible to everyone but private.
- Confirm with Submit.
- Click on the gearwheel icon in the top right-hand corner and adjust the settings.
- Specify which table should be displayed on the respective level. To do this, click in the field for Level 2 and Level 3 to select the desired table from the drop-down list. Level 1 is always occupied by the table in which the view is located.
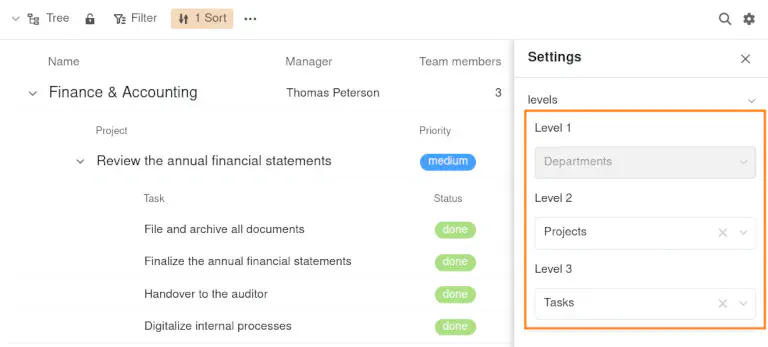
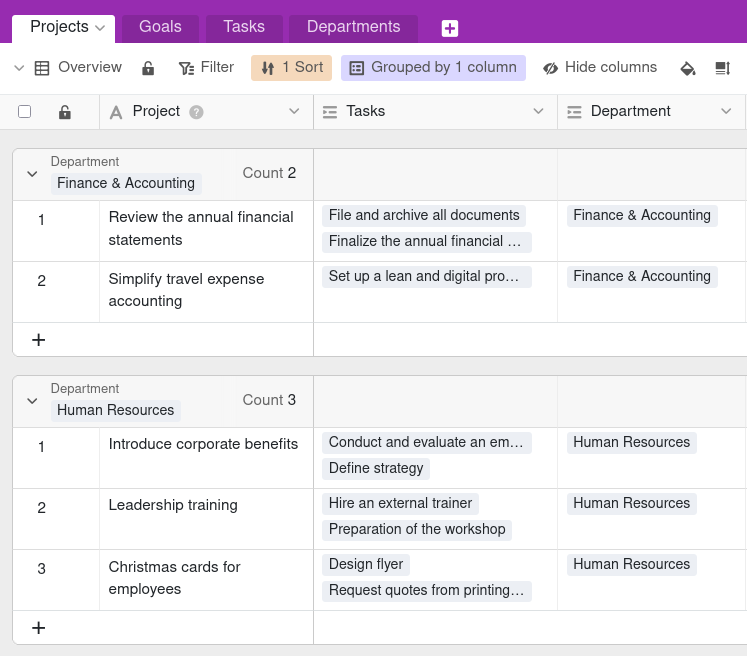
The linked data records on the second and third level of the tree diagram are then grouped under the respective higher-level data records.
Show and hide information
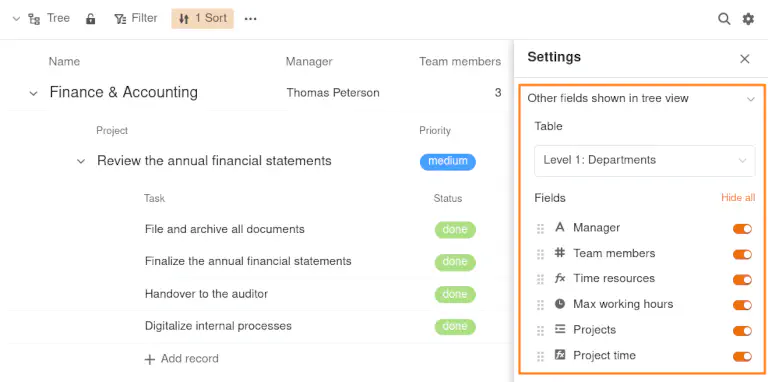
Via the Settings, which you can access by clicking on the gearwheel icon , you can define the visible columns for each level of the tree diagram. To do this, first select the level on which you want to show or hide columns. If you then deactivate the corresponding slider on the right-hand side, the columns are not visible in the tree diagram.
Move columns
You also have the option of arranging the columns differently from the table view at each level. To do this, hold down the left mouse button on the six-dot grab area in front of the column name and move the column by drag-and-drop to the desired position.
View options
You can use the following options in a tree view:
Collapse and expand linked data records
To collapse all linked data records under an entry, click on the drop-down arrow to the left of the row. To expand the data records again, proceed in the same way.
Adjust column width
To avoid truncated entries or large gaps between the values, you can adjust the column width as required. To do this, hold down the left mouse button on the boundary line between two columns and drag the cursor to the left or right.
Add and edit records in the tree view
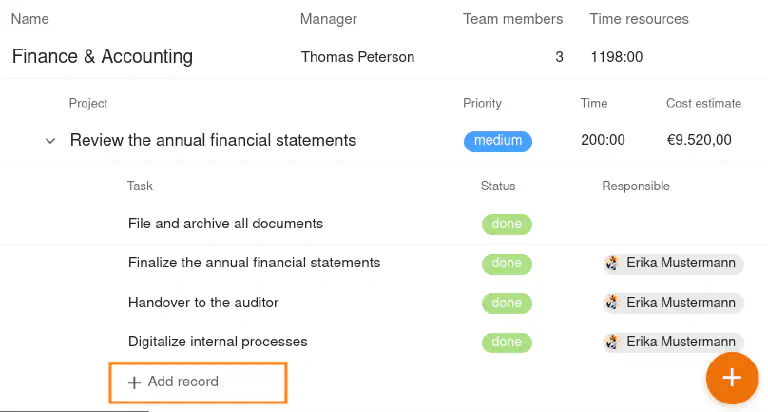
To add a new data record on the first level of the tree view, click on the orange circle with the plus symbol in the bottom right-hand corner. The Row details will then open. Fill these in as required and close the window to save the data record.
To add a new data record on the second or third level of the tree view, click on + Add record. The created row is automatically linked to the parent data record and grouped accordingly. You can fill in the remaining fields directly in the row.
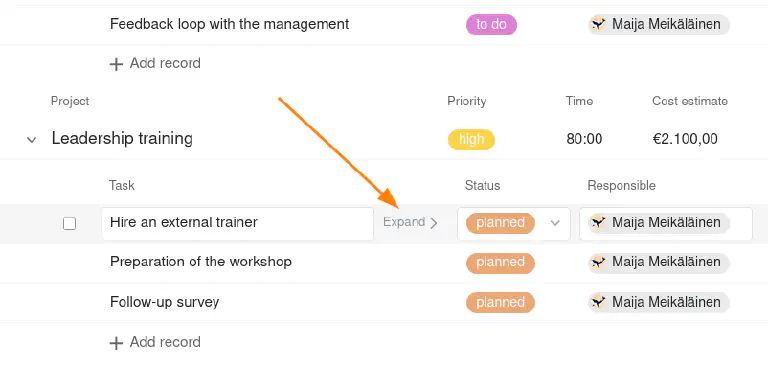
Existing entries can also be edited directly in the tree view. You can also click on Expand to open the row details and make changes.
The data is of course also saved in the underlying tables.