Table of Contents
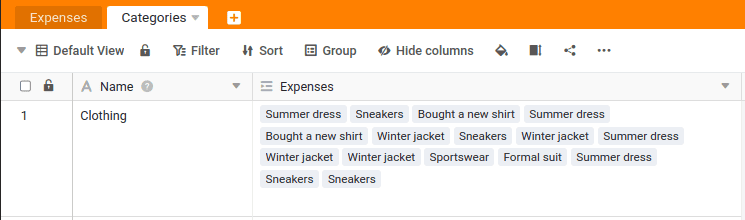
We have now linked the data records from both tables. It is important that this link is not one-sided. If you go to the table Categories you will see that a new column has also been added there, showing the links. In our case, this means that an issue is linked to a category, and a category can be linked to many issues.
We have not yet achieved any direct benefits from linking, but this is about to change: With the help of the links, we can create statistical evaluations in a matter of seconds. For example, we can easily determine how high the total of all expenses in the category Travel is.
Increasing the line height
First, increase the row height in the table Categoriesto see more of the links. You will find the corresponding option
in the row above the column name. You can also drag individual columns wider to see more content.
Evaluations of the categories
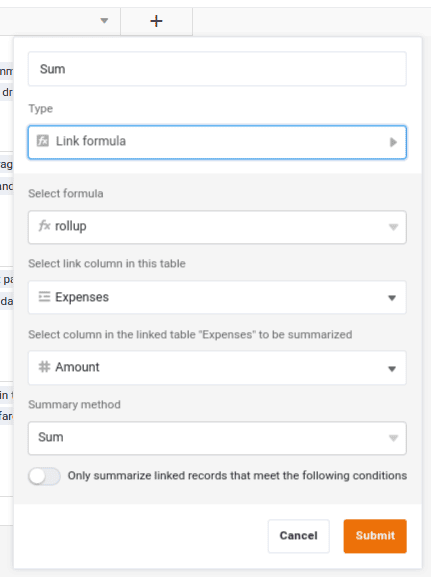
Now create a new column in the table Categories to.
Name:
SumColumn type:
Link formulaFormula used:
rollupLink column used:
ExpensesColumn used for the calculation:
AmountCalculation method
Sum
Next, you can change the format of the Sum to Euro so that the totals displayed are formatted accordingly in Euro.
Automatic calculation with every change
Isn’t that fantastic? In the column Sum the total expenses for each category are always displayed automatically. Even if you click on other expenses in the Expenses the total is updated immediately.
Of course, that’s not all. You could limit the analysis to individual years or add additional conditions. As you gain more experience with SeaTable, you will be able to create such evaluations with just a few clicks.
This brings us to the end of this section. Scroll to the end and skip to the sixth and penultimate topic of this online course.