Table of Contents
Whenever you look at your data in a table, you see it via a view. Even if you have created a brand new table, you are already viewing it in the “Default View” supplied as standard.
What are views used for?
In a conventional table, you always see the data in the same way. Although you can add or delete rows and columns, you cannot view the same data from different angles.
In SeaTable, you can create views and use filters, sorting, grouping, hiding, color highlighting and row height to determine which section of your data you want to view and how. This allows you to display exactly the data that is relevant to you without having to change or delete data records.
You can also select certain display formats to visualize the data in an appealing way. Here are examples of view types that you can create:
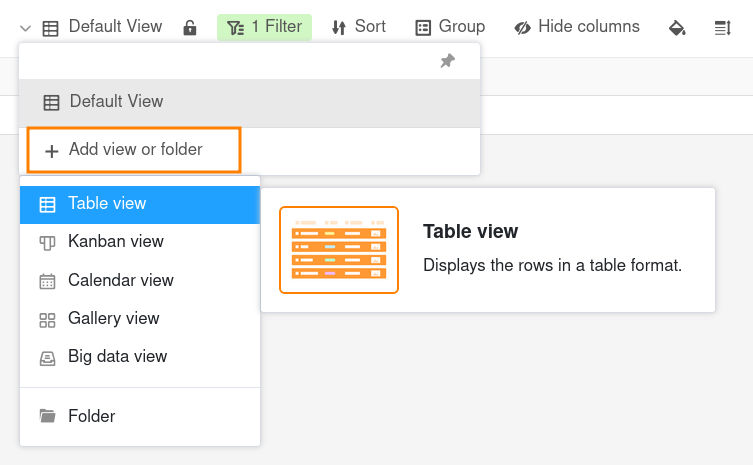
- Table view
- Kanban view
- Calendar view
- Gallery view
- Timeline view
- Tree view
- Big Data view
It is important to understand that a view is just another way of looking at the same underlying data! This means that if you edit the data of a table in one view, this data will change in all views of the table, as all views represent the same data set.
The table view
The table view is the standard display format in a SeaTable Base. It is very similar to a spreadsheet, as the data records are organized in rows and columns.
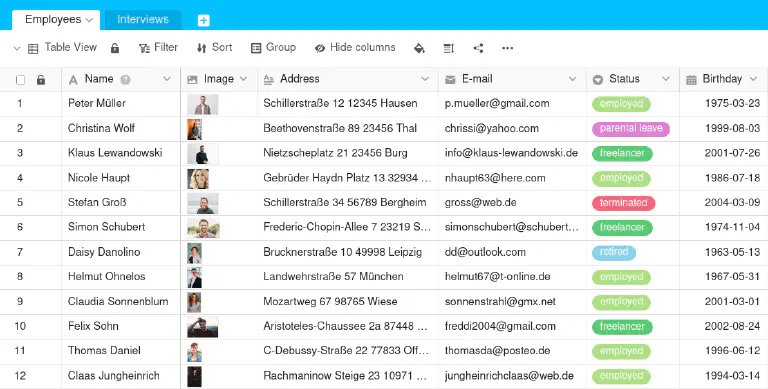
If you create a filtered view or hide columns, you will only see the amount of data you need. You can also make the view clearer by sorting or grouping according to certain organizing principles.
The Kanban view
If you have columns with a limited number of options in your table, you can group your rows together. A special form of display is the Kanban view. It is particularly suitable for displaying processes with different phases.
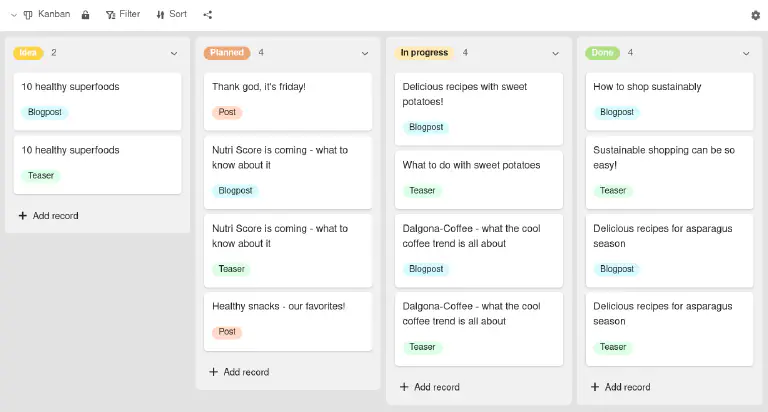
You can find out more about this in the article about the Kanban view .
The Calendar view
If you have a table with date columns, you can create a calendar view that organizes all your records chronologically.
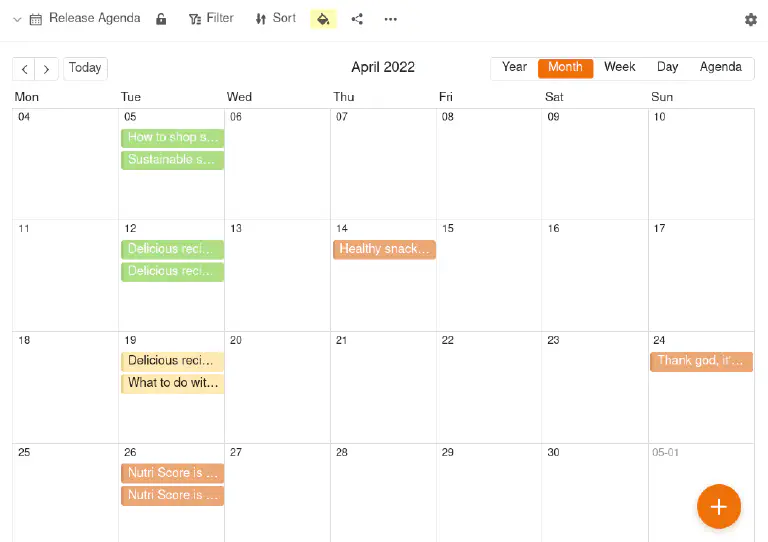
You can find out more about this in the article about the Calendar view .
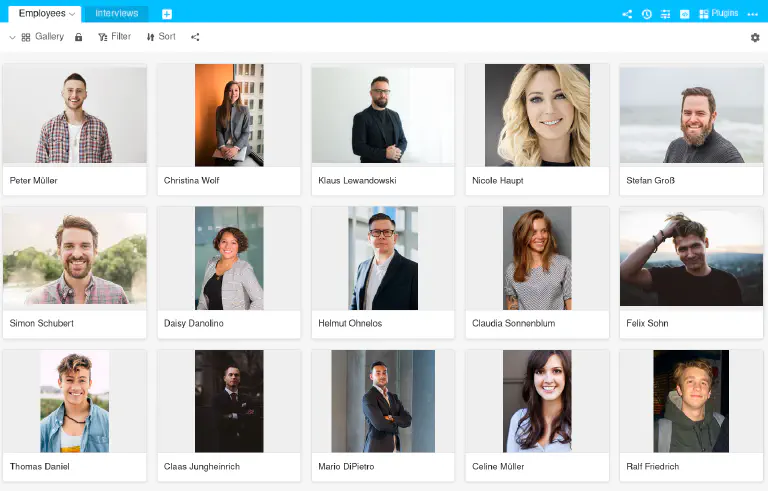
The Gallery view
If you have a table with an image column, you can create a gallery view to illustrate the data records with preview images.
You can find out more about this in the article about the Gallery view .
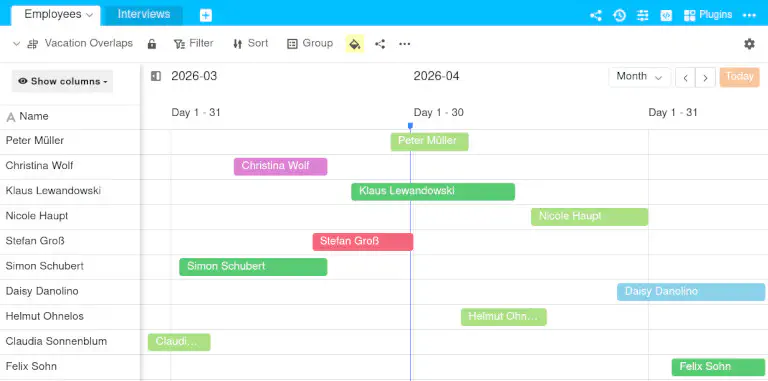
The Timeline view
If you have a table with two date columns, you can create a timeline view that visualizes various time spans on a timeline. It is particularly suitable for displaying the sequence of processes or checking whether time periods overlap – for example in vacation planning, project plans or room bookings.
You can find out more about this in the article about the Timeline view .
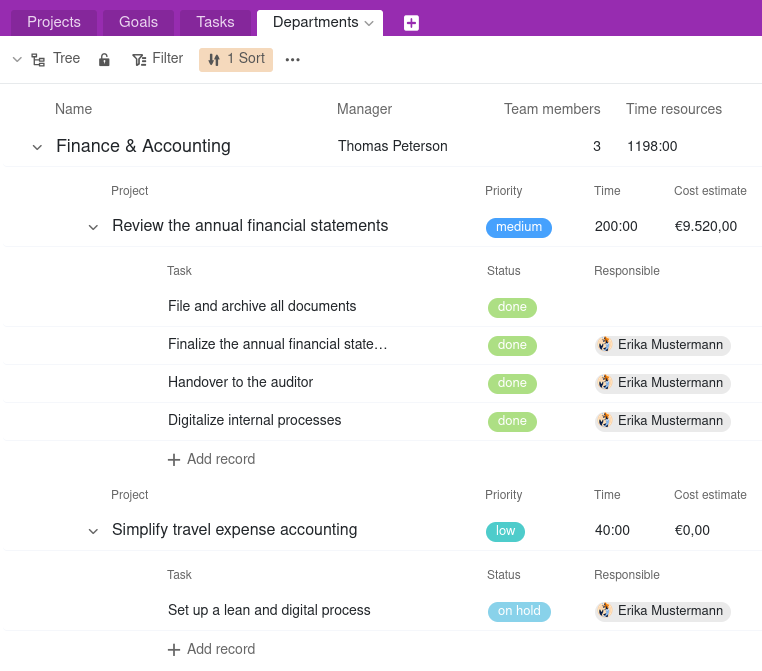
The Tree view
If you have a base with at least two linked tables, you can create a tree view to display linked records hierarchically. It is particularly suitable for visualizing complex structures such as project portfolios or organizational hierarchies – with up to three levels in the tree diagram.
You can find out more about this in the article about the Tree view .
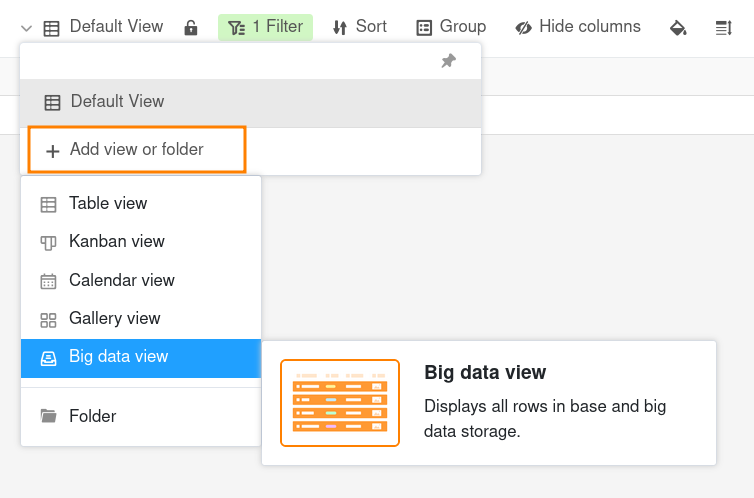
The Big Data view
If you have activated the Big Data storage in your Base, you can archive large amounts of data that are not immediately visible to every user. A special Big Data view is required to access the data in the big data storage.
You can find out more about this in the article about the Big Data view .
More articles on the subject of views
- Create a new view
- Rename a view
- Delete a view
- Duplicating views
- Differences between private and normal views
- Printing a view
- Change the order of views
- Group views in folders
- Filtering records in a View
- Link filter rules with AND and OR
- Sorting records in a View
- Grouping records in a view
- Cell coloring
- Color marking of cells
- Adjust row height
- Adjust the number of fixed columns
- Hide and move columns
- Lock Views
- Sharing a view with a team member
- Create external link for a view