Table of Contents
In order to keep track of who made what changes to the data in your bases and when, the history is temporarily stored in various places in SeaTable. There is an overall activity log on the start page, a log for each base and for each row. In addition, you can review automations and scripts that have been performed in an execution log for each.
Activity log
You can access the activity log at any time from the SeaTable home page.

In this overview you will find any changes that have been made in your bases. Note that the activity log shows all edits made by yourself, your team members, other users, and automations.
However, only the changes that have occurred in your bases within the last 7 days are displayed. Changes that occurred more than a week ago are automatically deleted from the log and can no longer be viewed here.
By clicking on the name of a base to be found in the log, you can open it in a new window.
To learn more about the changes made to a base, simply click on the changes next to a base’s name in the Activity Log.
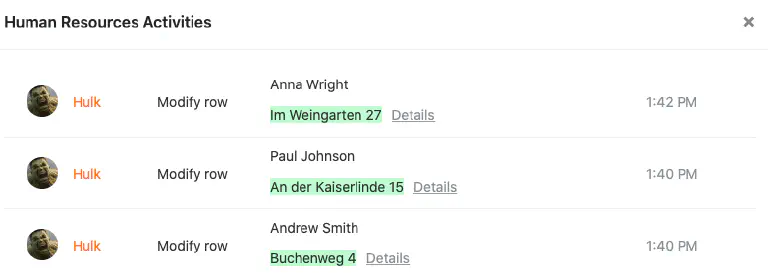
A window will then open where you can view various information about the changes made to the corresponding base, for example, the entries that were added to or removed from a base, a description of the changes, and the exact time when the editing took place.
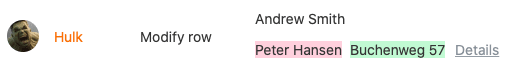
Note that added entries are always highlighted in green, while removed entries are red in the log.
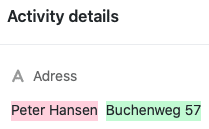
By clicking Details you can view the corresponding changes in a separate window.
Base log
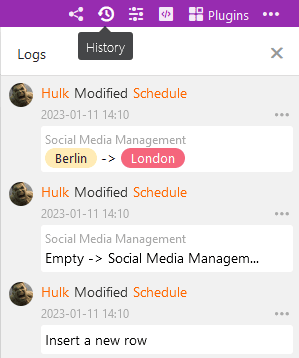
All activities performed in a base can be viewed in the so-called base log, which you can access via the base header.

In a base log you will find the latest changes that have been made to the corresponding base. Each log entry contains the following information:
- Name of the processor
- Nature of the change
- Table concerned
- Date of the change
- Description of the change
For more information about the base log and detailed instructions on how to undo changes above it, see this help article .
To increase the traceability of changes to rows in the big data storage , SeaTable offers a separate big data log. However, this log only appears as soon as the big data storage is activated in the base.
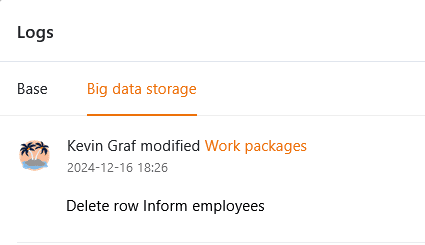
rows-Log
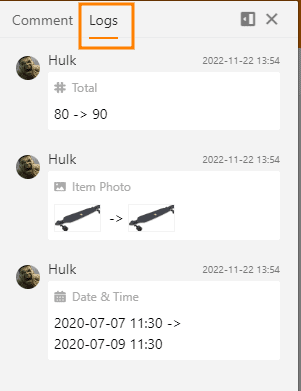
All changes made in a row can be viewed in the so-called rows-log, which you can reach by clicking on the double arrow symbol in the numbering column of a row .
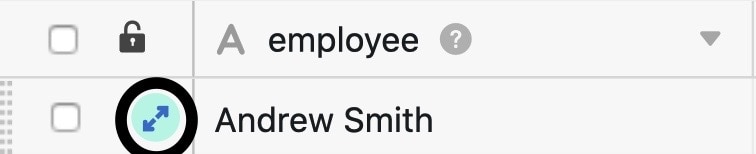
The rows-Log offers you the possibility to track when which user made which change to the record in a row file. If you want to view all changes in a base instead, you have to resort to the base log.
If you need more information about the rows log, please have a look at the corresponding help article .
Automation execution log
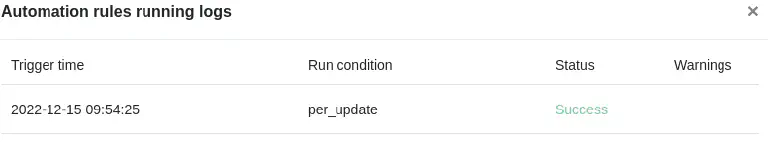
To check the correct execution of an automation, you have the possibility to view the execution log, which you can reach via the base options.

In this, SeaTable records the following information for each automation run: execution time, execution condition, status and warnings, if any.
More information about the execution log of an automation can be found here .
Execution log of scripts
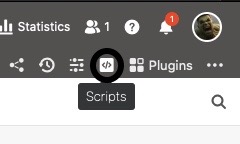
Scripts created in your bases also have an execution log, which you can access through the base options.
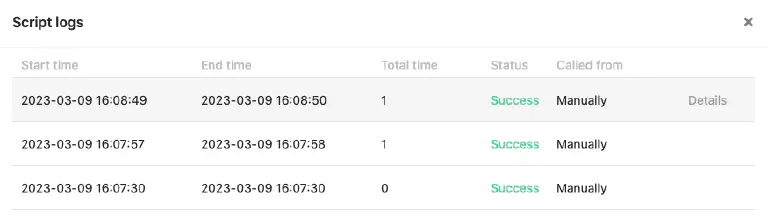
In the execution log you can find various useful information such as start time, end time, total duration and status of a script run.
If you need more information about the execution log of scripts, feel free to take a look at this help article .